Palo alto networks, inc
Prisma SASE: Autonomous Digital Experience Management (ADEM)
Overview
Prisma SASE AI‑Powered Autonomous Digital Experience Management (ADEM) is an innovative solution designed to empower IT operations teams by increasing productivity and delivering exceptional application experiences for users working from anywhere. As the Principal UX Designer at Palo Alto Networks, I led the UX strategy, research, and design execution for ADEM. The goal was to provide real-time visibility and actionable insights into application experience issues, enabling IT administrators to quickly identify and resolve problems affecting end-user experience.
ADEM is a Premium Add-On for Strata Cloud Manager. It gives users complete visibility and procative control over application access and experience issues.
The problem
Network administrators were facing an overwhelming number of support tickets related to degraded application experiences. Troubleshooting these issues was challenging due to a lack of visibility into the various factors affecting end users—such as device performance, local network conditions, and internet connectivity. Before the introduction of Real User Monitoring (RUM), ADEM relied solely on synthetic tests that simulated network conditions. While useful for baseline measurements, synthetic tests alone limited the ability to diagnose real-world issues, as they could not capture actual user interactions or device-specific problems in real time.
The Solution
One of the major UX contributions to ADEM was the development of the Real User Monitoring feature, which significantly enhanced the product’s capabilities beyond synthetic testing. The solution encompassed several key innovations:
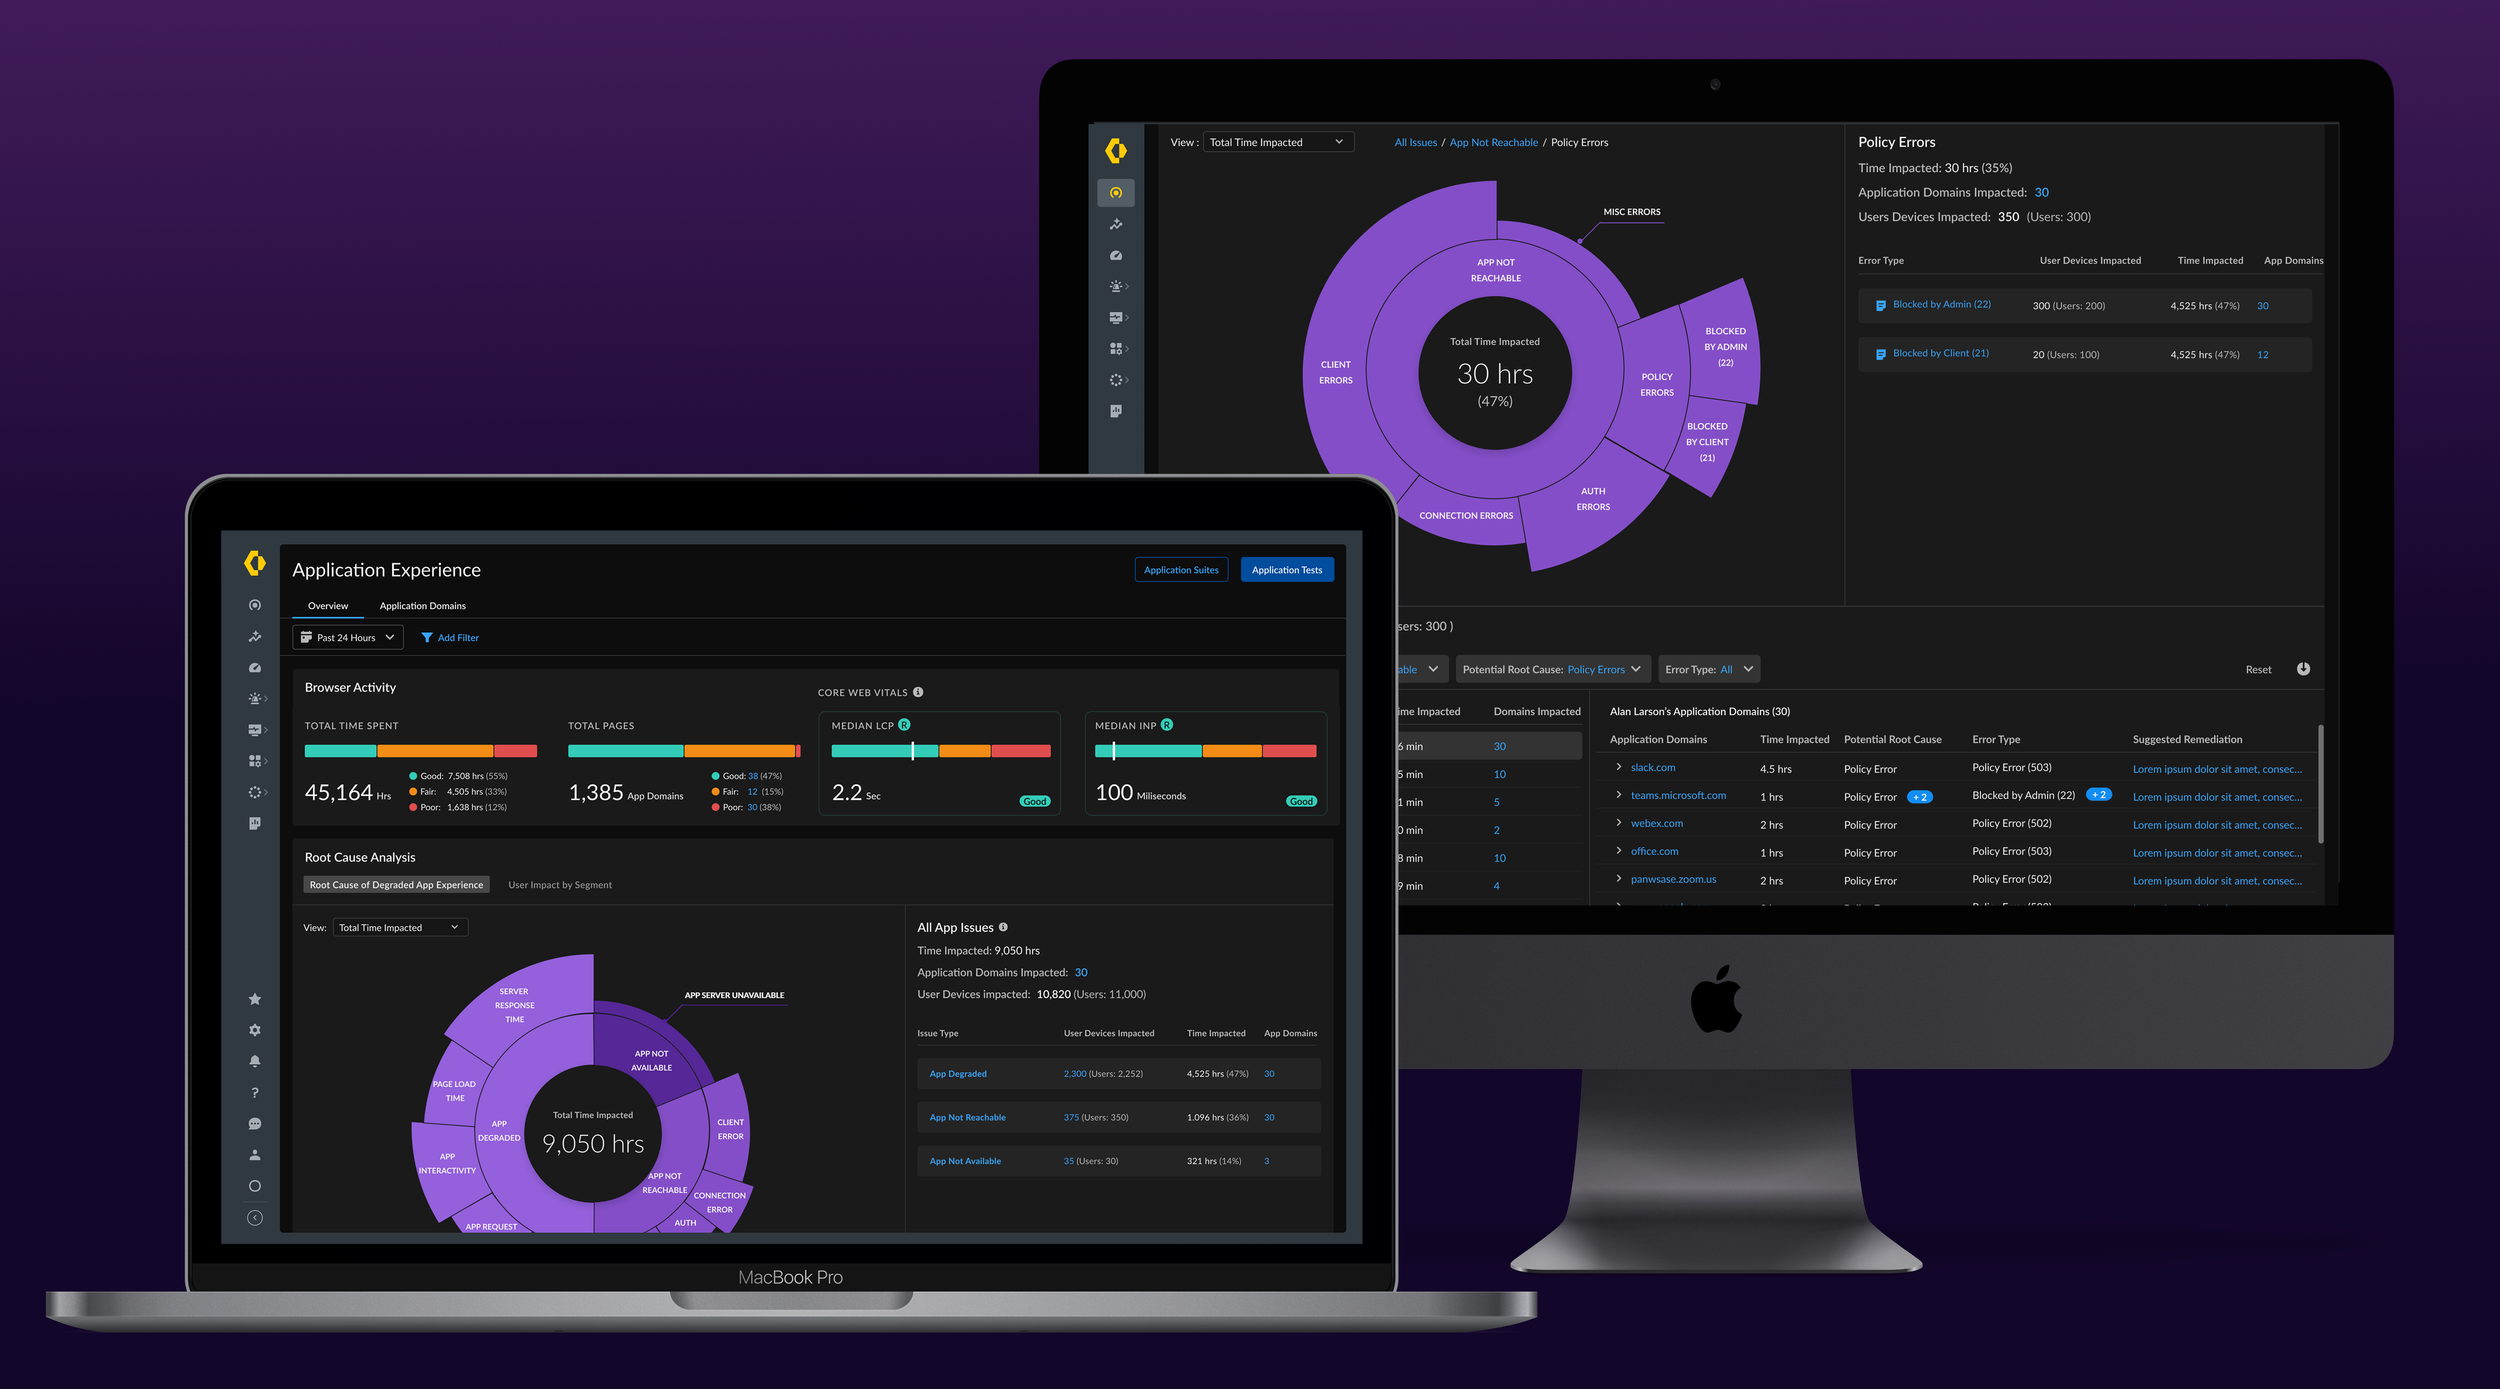
Interactive Visualization: We introduced an intuitive interface that provides a visual overview of user experience issues, making it easier to identify trends and prioritize problems. It provides a complete overview of Application Experience issues glance—as well as drill down into categories to identify granular solutions. It incorporates web performance metrics (like Core Web Vitals) to quickly highlight if a significant portion of user activity is experiencing slow or degraded performance. This visualization enables administrators to spot widespread issues immediately and focus on the areas that need attention.
Root Cause Analysis Enhancements: We improved troubleshooting workflows by enabling administrators to pinpoint specific causes of degraded application experiences. The system now correlates data from real user interactions and synthetic tests to isolate whether a problem stems from the device, local network, or application backend.
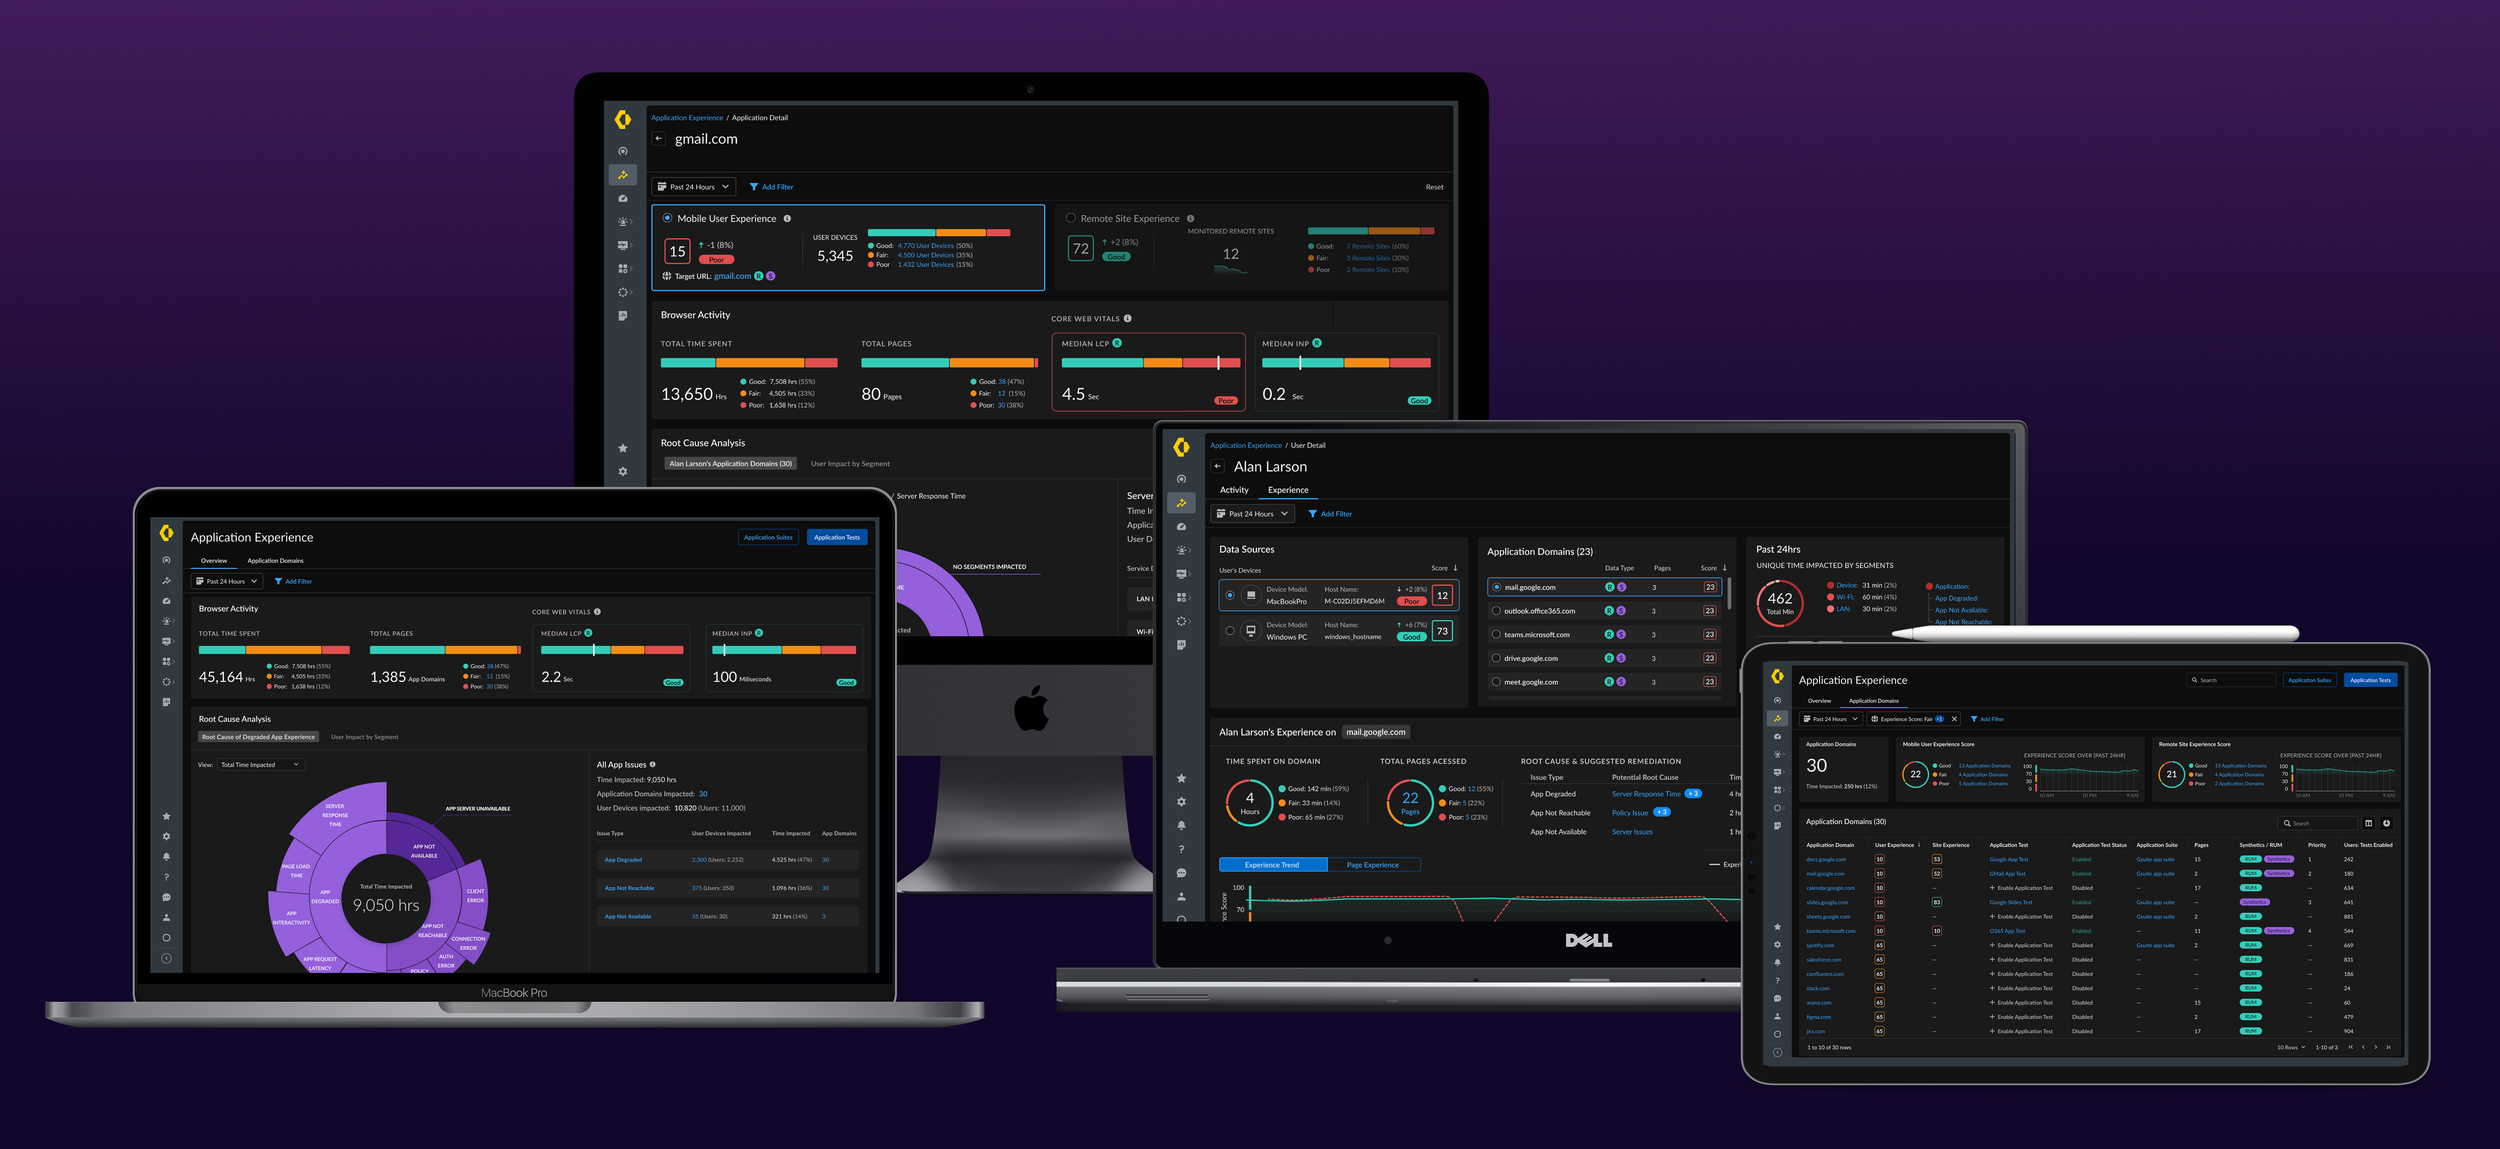
As users drill down into the segmented sunburst chart (shown above) they can identify the contributing factor to poor experiences (e.g., Device issues, LAN performance, or Application errors). Each segment expands into details (like high CPU usage on the device, Wi-Fi latency, or slow server response) and is accompanied by a list of impacted users along with suggested remediation steps. This visual approach reduces guesswork by clearly indicating the primary drivers of performance issues, allowing IT teams to drill down on the exact root cause.
Actionable Insights: Beyond just identifying issues, ADEM now provides the ability to take immediate corrective actions. The interface surfaces recommended remediation for the detected problems (for instance, advising to upgrade an endpoint client, or reconfigure a network setting) and allows administrators to link out to relevant tools or scripts. By having these insights and next steps directly within the ADEM console, IT teams can reduce time-to-resolution — often resolving issues in minutes that previously might have required lengthy investigation.
I redesigned Root Cause Analysis experience to align with our users mental model and provide key actions to troubleshoot issues more effectively, and faster.
Target Users
ADEM has 2 primary types of users. A primary task of personas is troubleshooting application access, and experience quality issues.
IT Administrators – Manage user access, troubleshoot authentication issues, and ensure seamless connectivity.
Network Administrators – Diagnose network performance and connectivity failures across distributed users, applications,
and locations.
UX Research & Process
Data-Driven Insights: We regularly reviewed qualitative feedback and quantitative analytics to identify key problem areas. Support ticket logs and usage data helped highlight where the existing product was falling short in diagnosing user experience issues.
User Interviews: We conducted in-depth interviews and discovery sessions with IT administrators. These conversations uncovered pain points in their current workflow—such as difficulty pinpointing whether an issue originated on the user’s device, the network, or the application itself. Insights from users helped us refine feature requirements for more effective monitoring tools.
Usability Testing: Throughout the design cycle, we created interactive prototypes and performed iterative usability tests with real users. Before launch, these sessions ensured the new features (like the RUM dashboard and root cause analysis views) were intuitive, met user expectations, and significantly improved troubleshooting efficiency.
User details are just a click away after selecting any issue type. The new design offers total visibility and granular control over issues affecting any user.
My Role
Principal UX Designer responsible for UX Strategy and Design of this feature.
Employed a data-driven design approach, working closely with UX Research
I facilitated “Data Dive-In” meetings where myself, the Product lead, and UX researcher met monthly to review Pendo data, form insights, and hypotheses to guide the design enhancements to this feature.
Worked closely with Product and Engineering teams to incorporate actionable workflows for our users.
Partnered with UX Lead for our AI Copilot product to define Generative AI experience and ensure our integrations were aligned.
Drove awareness for the initiative, adoption, and consistency with teams internally.
Impact & Results
The introduction of Real User Monitoring and the associated UX improvements led to significant positive outcomes:
Enhanced Data Accuracy: ADEM now presents a complete picture of actual user experience rather than relying solely on simulations. This accuracy means issues that were once missed by synthetic tests (like a specific webpage error or a user’s device slowdown) are now captured in real time, leading to more reliable monitoring of application performance.
Improved Troubleshooting Speed: With clearer visuals and pinpointed root causes, IT teams are able to resolve issues faster. Early users of the new RUM feature reported substantially lower mean time to resolution for support tickets, which in turn reduces end-user frustration and downtime. Administrators can proactively address problems (often before users even report them) thanks to alerts and remediation suggestions, thereby increasing overall productivity.
Higher User Engagement: The value provided by the enhanced insights and troubleshooting capabilities has driven increased engagement with the ADEM product. IT operations teams are logging in more frequently to the ADEM dashboard to check the health of applications and the network. The ease of identifying actionable items has led to ADEM becoming a go-to tool in their daily workflow, as it consistently helps prevent minor issues from turning into major incidents.
Conclusion
This case study highlights how strong UX research, thoughtful design, and data-driven decisions led to a transformative product feature. By evolving ADEM with Real User Monitoring and an improved UI, we empowered IT operations to troubleshoot more effectively and deliver exceptional digital experiences for users worldwide. The end result is a more proactive IT team and a smoother, more reliable experience for every user working from anywhere.